EXPLORE THE LIVE DASHBOARD
The idea
Ask a room of designers what orange means and you’ll hear joy and warmth. Ask the same question in 37 countries and the answers start to drift.
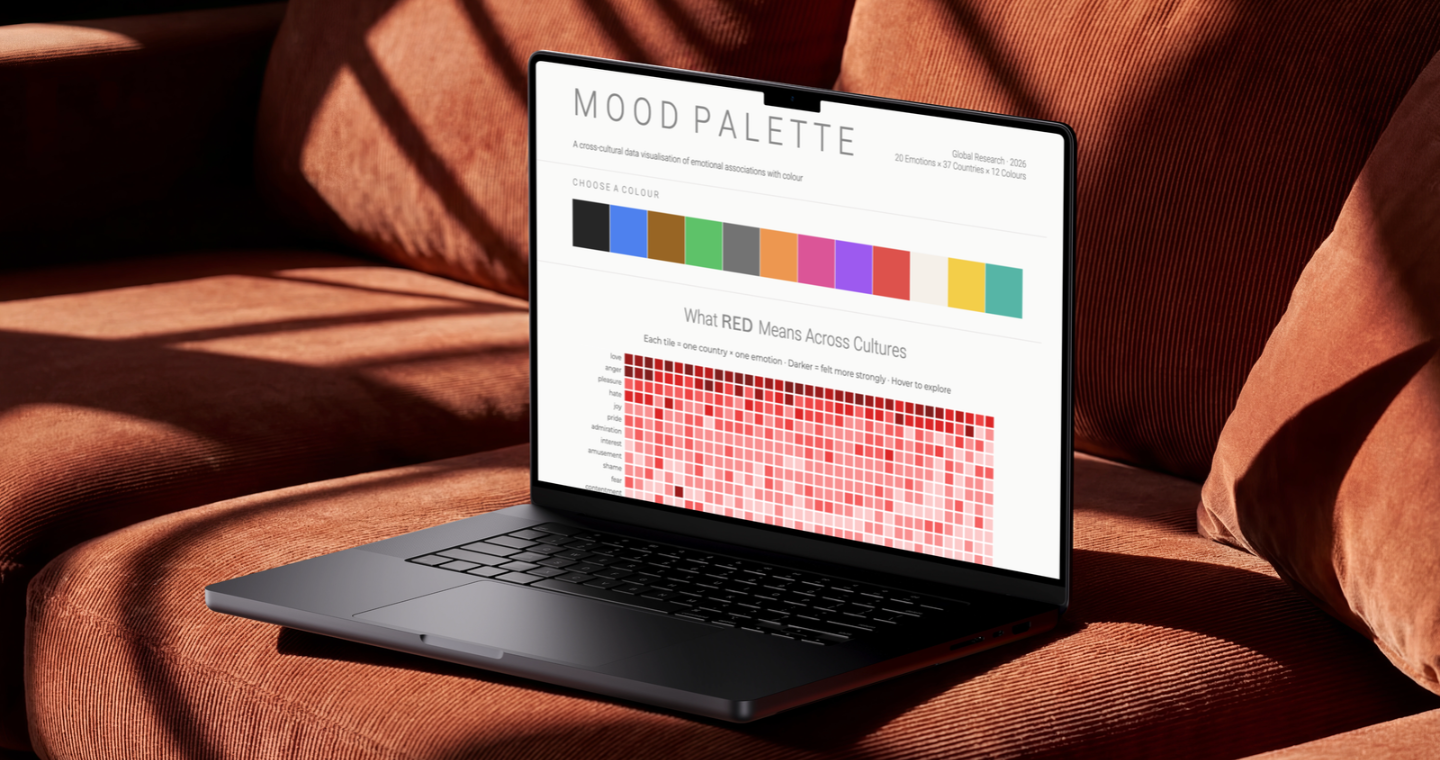
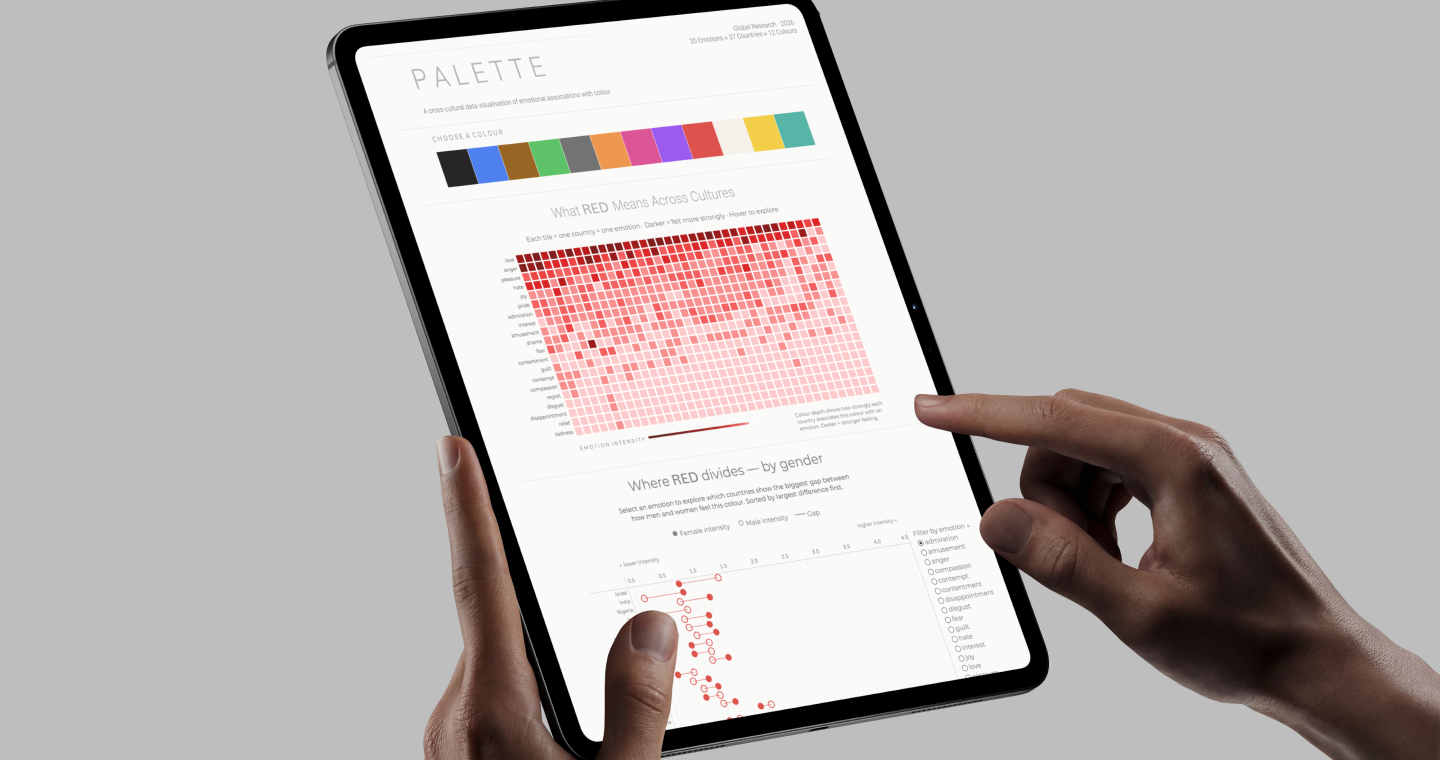
Ruby built Mood Palette to show that drift. She created it for DVB302, a Data Visualisation unit, where the brief was to find a real dataset and turn it into an interactive multivariate visualisation in Tableau. The result turns around 103,000 survey responses into something you can actually play with.
It’s made for brand designers and creative strategists working across cultural markets, so they can test a colour choice against real data before it’s locked in.
What surprised me most was how differently the same colour lands depending on who’s looking. Every colour tells a different story across cultures and genders, and I kept finding new ones the more I explored.
Ruby
How it works
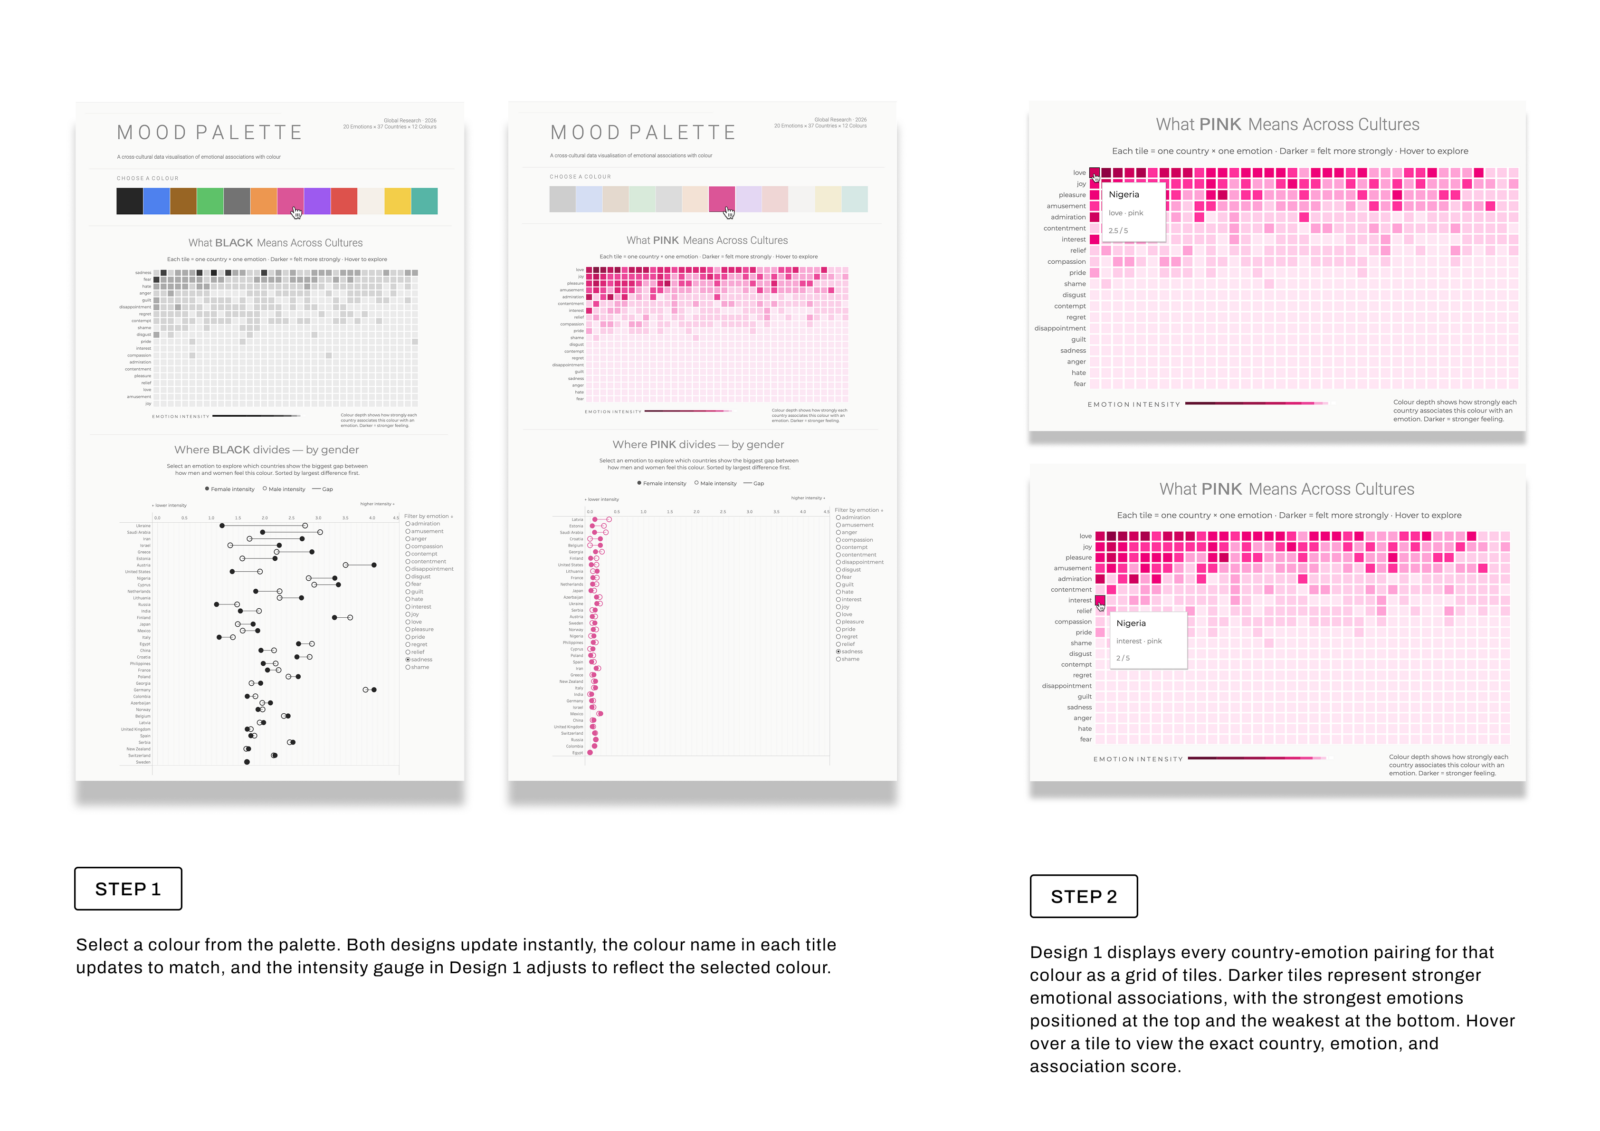
1. Pick a colour. Both views update instantly to show that colour.
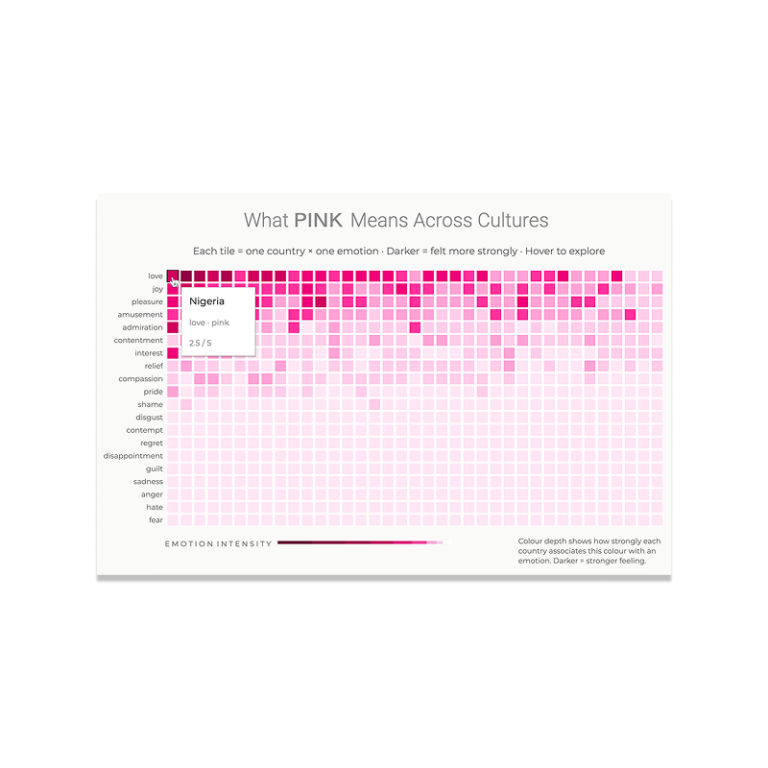
2. Read the heat map. Darker tiles mean a stronger link between the colour and an emotion. Hover any tile for the exact score.
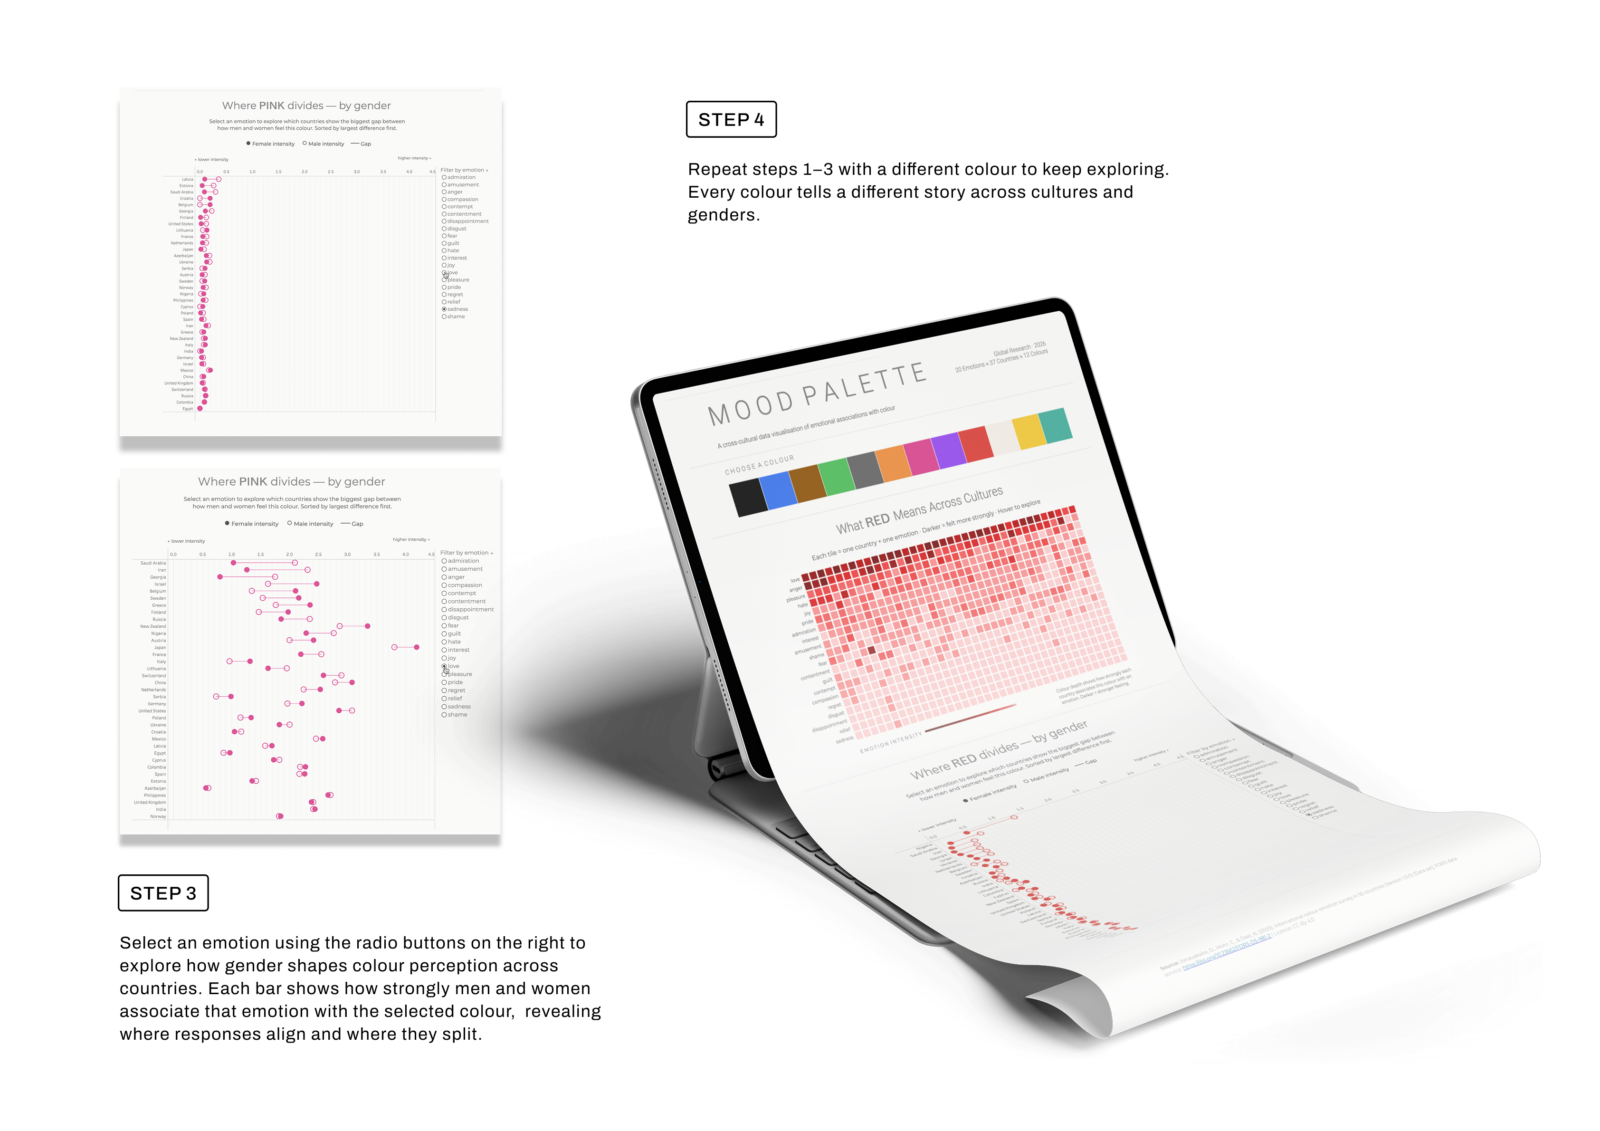
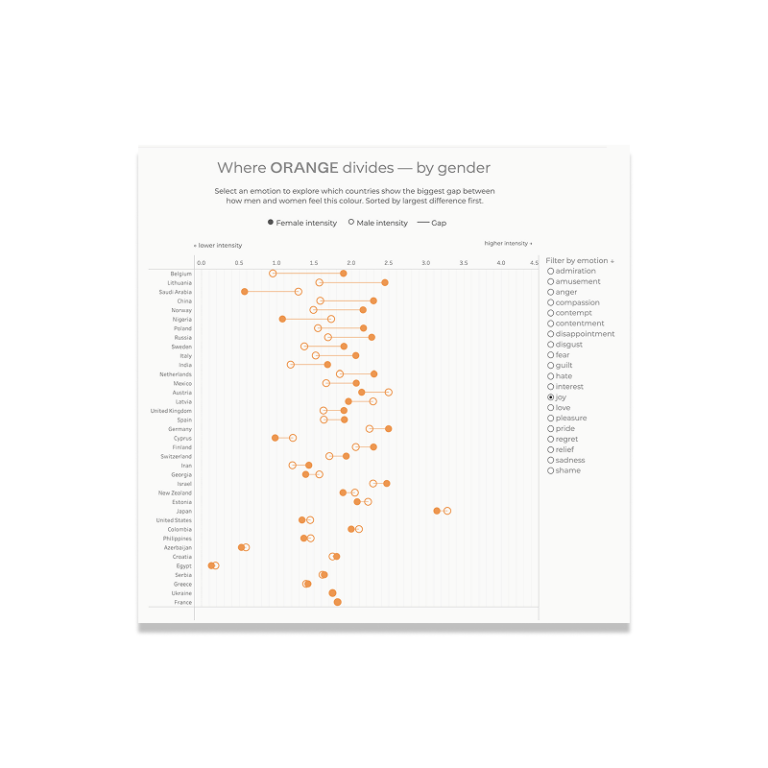
3. Choose an emotion. The gender view re-sorts to show where men and women differ most.
4. Switch colours and see how the story changes.
From 103,000 responses to two clear views
The raw survey data was far too big to use as it was. Ruby cleaned and filtered it in Excel, averaged the scores for every colour, country, emotion and gender combination, then reshaped it so Tableau could read it.
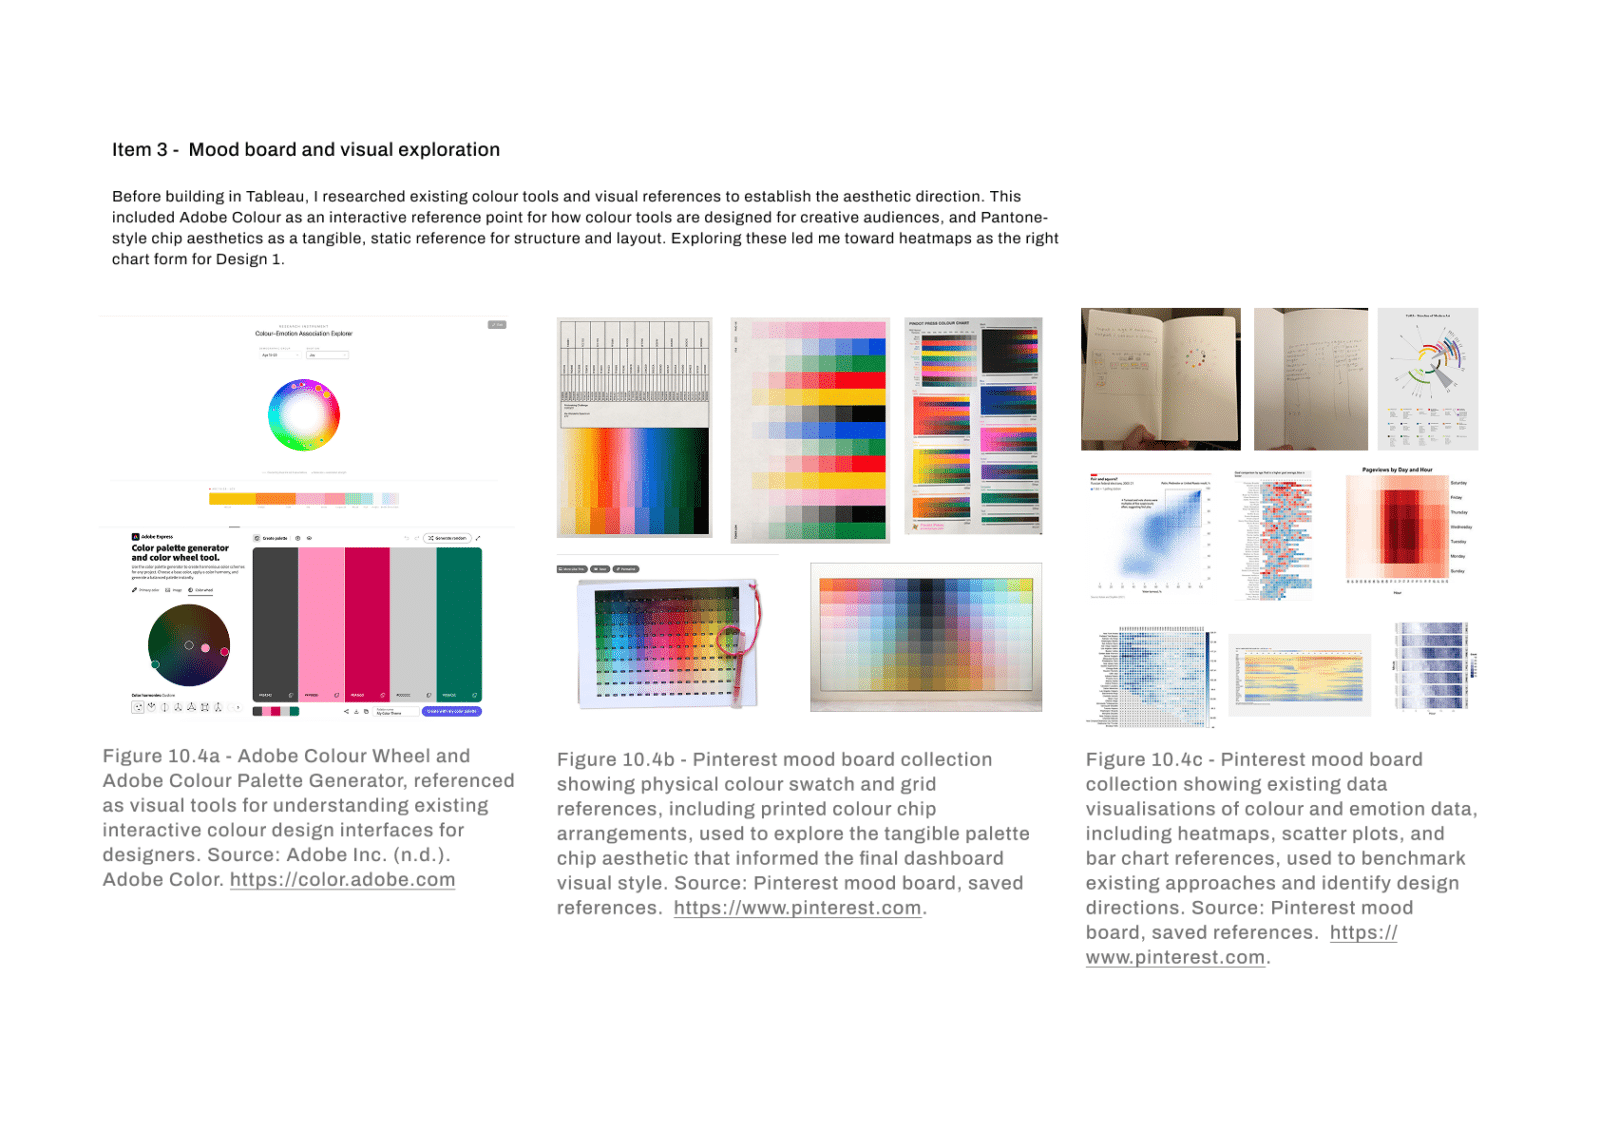
The design side started with a mood board of colour tools and data visualisations. Ruby was especially inspired by Adobe Color’s colour wheel (https://color.adobe.com/create/color-wheel), where you pick a colour and everything else updates around it, and by how simple and uncluttered its interface feels.
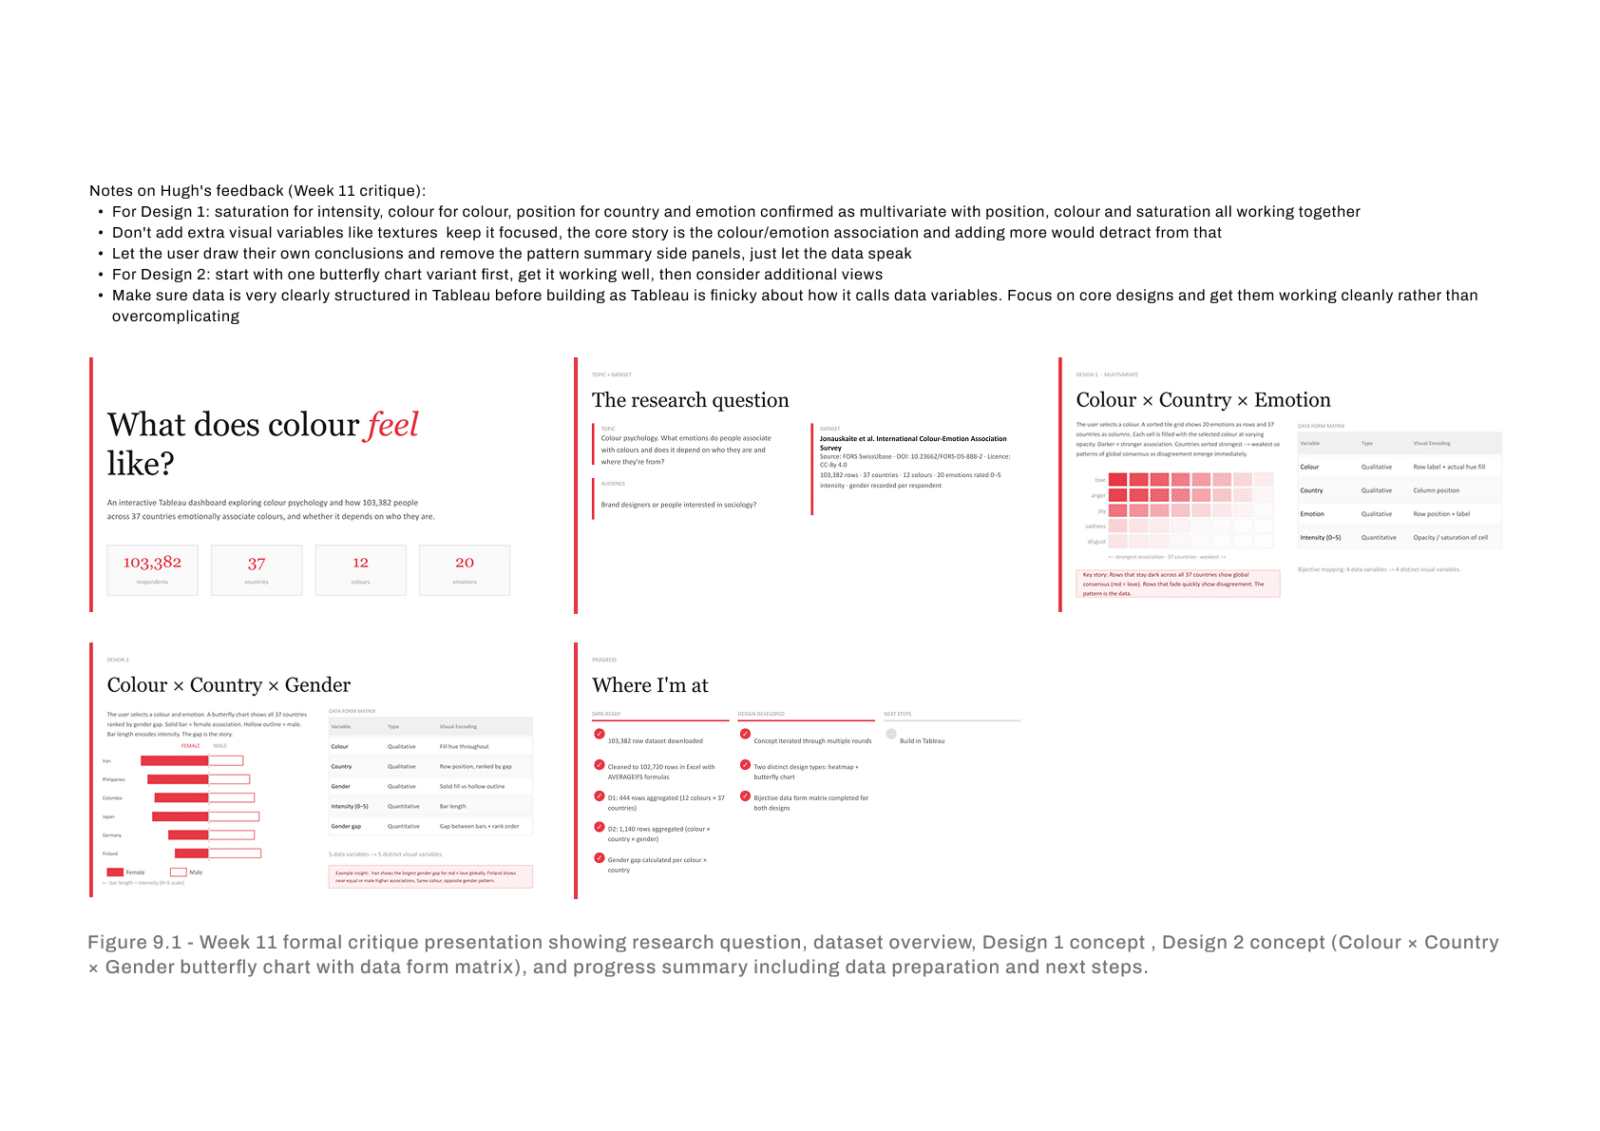
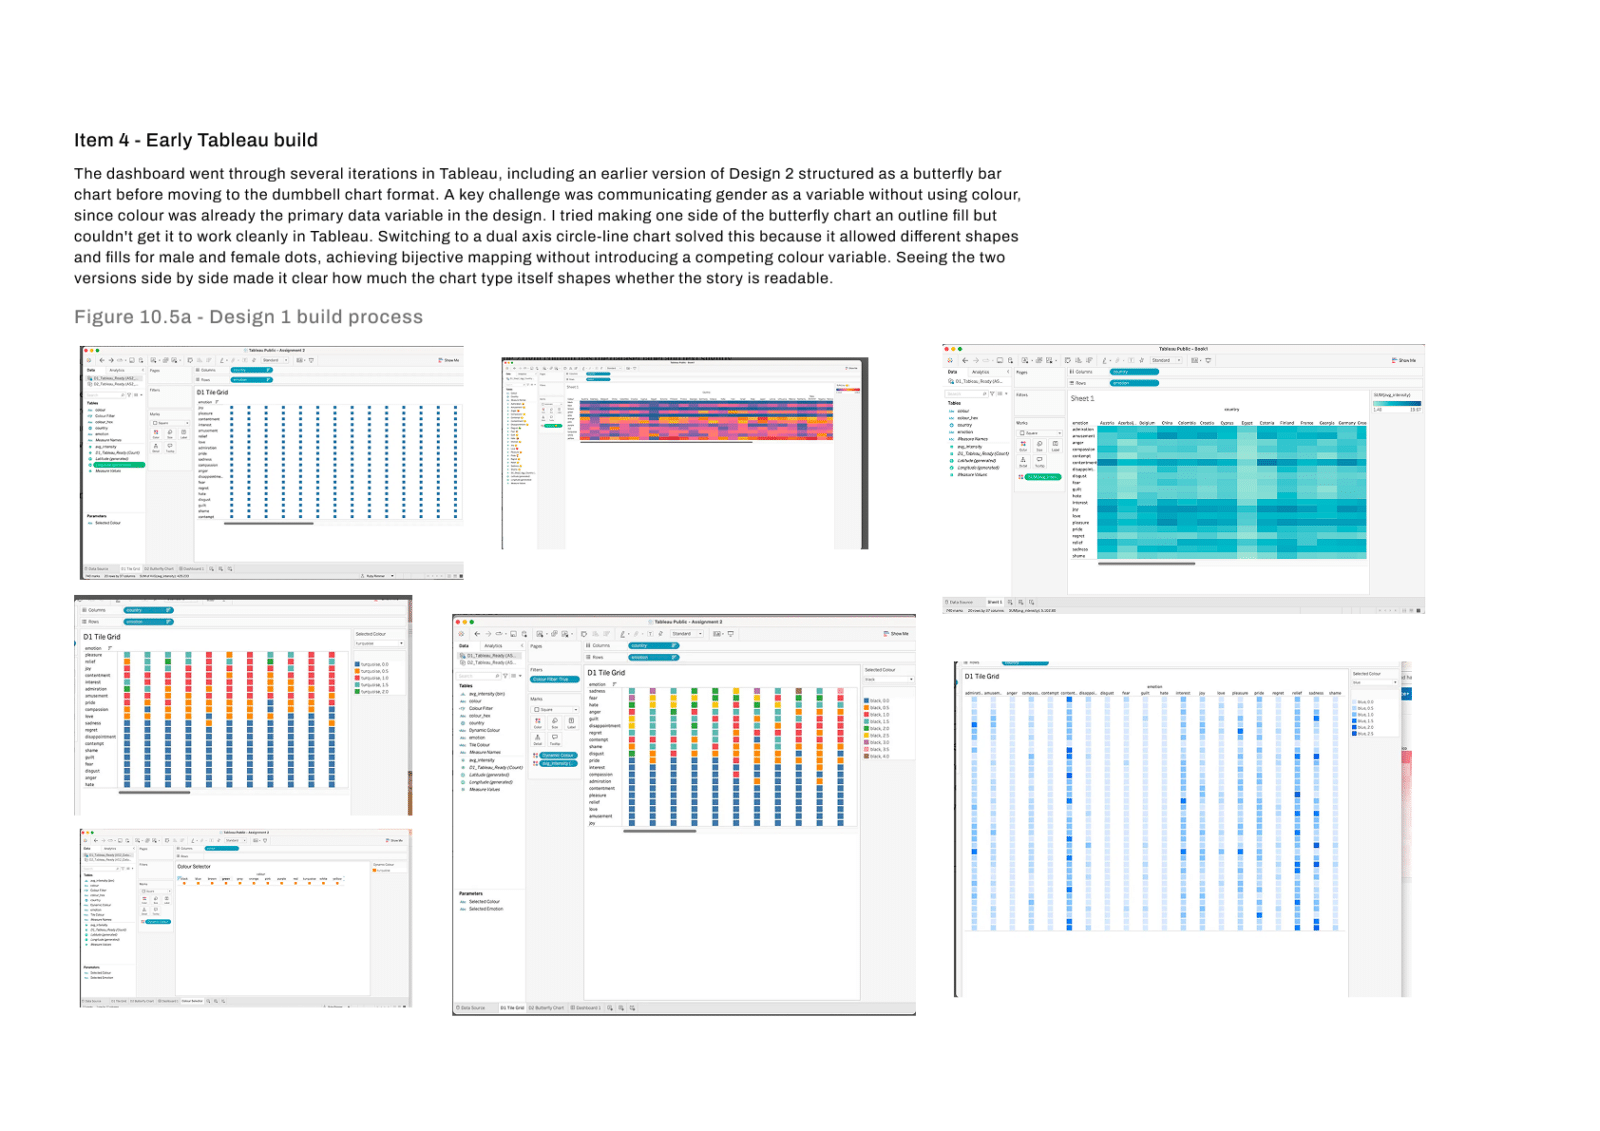
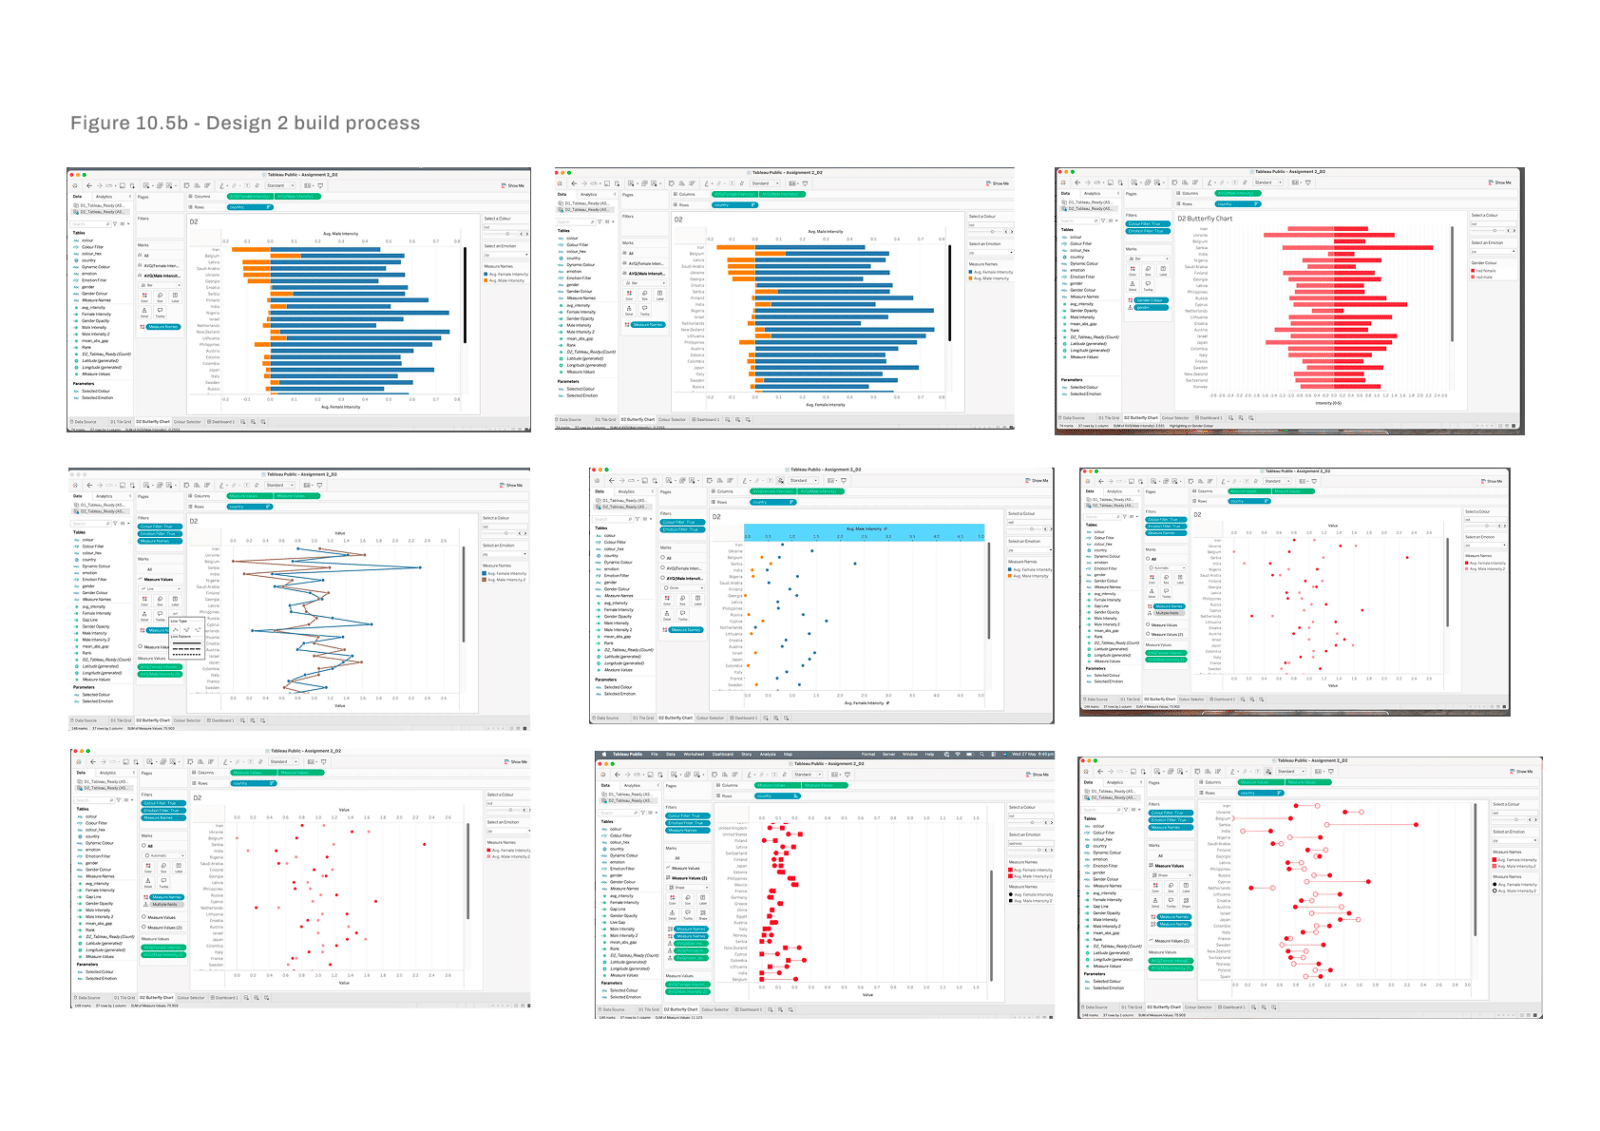
She brought that same pick-and-explore simplicity into Mood Palette. From there she tested layout after layout in Tableau, put them through a class critique, and kept the two views that told the clearest story.
From there she tested layout after layout in Tableau, put them through a class critique, and kept the two views that told the clearest story.
What’s next
What Ruby enjoyed most about Mood Palette was the problem solving. Taking a huge spreadsheet of survey responses and figuring out how to turn it into something meaningful, engaging and interactive was a challenge she really enjoyed.
One of her biggest learnings was to be more patient with the creative process. At first, she was eager to find a story and start designing, but she found that the best ideas came from spending time exploring the data, experimenting with different visualisations and seeing what stood out.
The project also gave her a new appreciation for data visualisation and how much thoughtful design can change the way people understand information. She’s already bringing these skills into her work, from applying visualisation principles to thinking more carefully about how complex information is presented and experienced by users.
Find out what your favourite colour means
-
About the data
Source: International Colour-Emotion Association Survey, Jonauskaite et al. (2020). Around 103,000 responses from 37 countries. Participants rated 12 colours against 20 emotions on a scale from 0 (not felt) to 5 (strongly felt). The dashboard shows average scores for each colour, country, emotion and gender. Data prepared in Excel and visualised in Tableau.